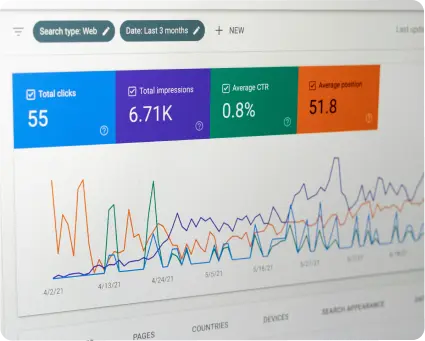
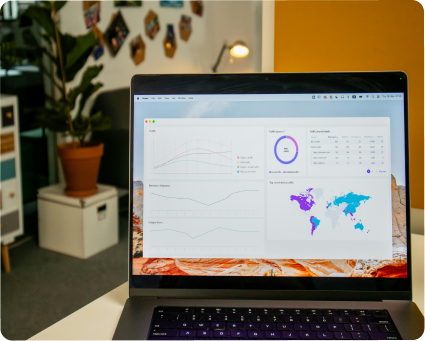
Directio Data Visualization Consulting Services
Unlock the power of your data with Directio’s data visualization services. Transform complex datasets into clear, actionable insights with our expertly crafted visual representations.


Whether you’re monitoring key performance indicators, analyzing market trends, or tracking customer behavior, our data visualization tools enable you to grasp intricate details quickly and make informed decisions. Directio’s visualizations are designed to be intuitive and engaging, helping stakeholders at all levels of your organization understand the significance of data and its impact on your strategic goals.
Data Visualization Benefits
- Improved Decision-Making
- Enhanced Data Interaction
- Effective Communication
- Trend Identification
Data visualization services and consulting transform raw data into clear, actionable insights. By presenting complex information graphically, decision-makers can quickly grasp what the data means and how it affects their business, leading to faster and more informed decisions.

Visualizations allow users to interact with their data in dynamic ways. This interactivity enables users to drill down into metrics, explore different scenarios, and discover correlations that are not evident in traditional reports, fostering a deeper understanding of the data.

Data visualizations created by Directio serve as powerful communication tools that can convey stories behind the numbers to all levels of an organization. They help to align teams around visible facts, enhancing collaboration and consensus for strategic directions.

Sophisticated data visualization tools help in identifying trends and patterns that might go unnoticed in text-based data. This benefit is crucial for anticipating market changes and adjusting strategies accordingly, ensuring that businesses remain proactive rather than reactive.

Are you Ready for Your Data Visualization Solutions?

Data Visualization with Directio: Is It for You?
Are you looking for Data Visualization Agency?
VARIETY OF DATA VISUALIZATION OPTIONS
Our range of Data Visualization Services
Custom
BI Solutions
We deliver complete, expert teams directly to your project, instantly amplifying your capabilities with ready-to-go talent.
Data integrations and ETL
We provide specialized talent directly to your team, enhancing your projects with expert skills on demand.
Data
Storytelling
We take your project from concept to completion with our full-stack expertise.
Advanced
Analytics
We offer tailored advice and solutions to navigate your project’s most complex challenges.
Can’t find a suitable option?
FROM NUMBERS TO NARRATIVES: SEE THE BIGGER PICTURE
Our Difference in Delivering Data Visualization Services

Predictive Analytics Integration
Complex Data Correlation
Real-time Data Processing

Actionable Insight Delivery
User-Centric Visualization Interfaces
Integrated Business Intelligence

Excellence in Every Interaction
Strategic Communication Frameworks
Continuous Improvement Mechanisms
Lean Process Implementation
We’re deeply commited to deliver exceptional service.
Trusted by some of the fastest growing and biggest companies:

Let the Numbers Tell Your Story
It’s like turning your raw data into a blockbuster movie – where numbers tell their story, all thanks to meticulous crafting behind the scenes. You need the experts in this craft, ensuring every data point plays its part.
Wojciech Biedziński
Delivery Director
TESTIMONIALS
What Do Our Clients Say?

DATA VISUALIZATION SERVICES
What Do We Promise?
Expert Data Visualization
Custom-Designed Dashboards & user-specific interfaces, Sector-targeted visualization, industry compliance Dynamic data interaction & actionable reporting
Unmatched Data Quality and Accuracy
High-accuracy visualizations & error-free reporting Rigorous QA testing, validation protocols Clear data presentation
Advanced Security and Confidentiality
Secure data handling & protected data transfers Regulatory compliance and GDPR adherence Client data protection & secure data practices
Continious Support and Scalability
Adaptive Solutions: Scalable analytics with growth-ready frameworks Ongoing Tech Support with client-focused assistance Evolving analytics & adaptive data strategies
Transform Your Data into Insights in 3 simple Steps
1
Initial
Discovery Session
Begin with an in-depth consultation to make sure understand your data landscape, define your analytical goals, and identify key performance indicators.
2
Custom Visualization Design and Development
Pair up with our expert data scientists to build visualizations designed not only to make complex information easily understandable but also to aligned with your organizational objectives.
3
Implementation and Ongoing Refinement
Benefit from hassle-free rollout and refinement ensuring your visual tools remain relevant, insightful, and capable of driving continuous improvement across your business.
Ready for Data Visualization Consulting?
MAKING POSITIVE IMPACT
How Do We Make Work Easier for Managers ?

We provide a comprehensive range of tech services, from IT outsourcing to full-scale software development and ongoing support. Our team focuses on improving your efficiency, productivity, and innovation, ensuring your business remains competitive.

We help many kinds of businesses, from SaaS startups to big enterprises, across various innovative industries. We have extensive expertise in working with corporate clients in the FMCG, automotive, and retail sectors, as well as for mid-sized businesses in IT services and SaaS.

With meticulous yet agile approach we kick things off by diving into a thorough analysis of your requirements. Based on this analysis, we choose the best methods, technologies and solutions tailored to your unique business needs.
FAQ
Frequently Asked Questions
Data visualization is crucial because it transforms complex data sets into a visual context, such as graphs or maps, making it easier to understand patterns, trends, and insights. This visual representation helps to quickly grasp difficult concepts or identify new patterns, facilitating better comprehension and communication of information.
Data visualization aids decision-making by providing clear and actionable insights from data. Visual tools allow decision-makers to quickly identify trends, correlations, and outliers. This clarity and speed in understanding data enable more informed, accurate, and timely decisions, reducing the risk of errors and improving strategic planning.
We offer a wide range of data visualization services, including dashboard creation, interactive visualizations, custom report generation, and data storytelling to help you understand and present your data effectively.
Lorem ipsum dolor sit amet, consectetur adipiscing elit. Mauris vehicula odio sed ex maximus feugiat. Fusce in justo at erat vulputate bibendum in id urna. Proin non tempor nibh. Curabitur cursus elementum urna, et maximus enim pulvinar nec. Donec sit amet lobortis est. Nullam massa erat, sollicitudin ac posuere nec, efficitur ac nulla. Sed justo magna, tincidunt euismod luctus vitae, ultricies at felis. Donec id velit eget mauris tempus ornare vitae quis nunc. Proin venenatis dictum metus, viverra venenatis mauris pellentesque a. Mauris vitae magna ante. Suspendisse non scelerisque purus, interdum consectetur enim. Interdum et malesuada fames ac ante ipsum primis in faucibus. Proin id pellentesque ex, in varius felis. Fusce eget vehicula tellus.
We use a variety of industry-leading tools and technologies such as Tableau, Power BI, D3.js, and custom solutions to create compelling visualizations tailored to your needs.
Yes, we can integrate data from various sources including databases, cloud services, spreadsheets, and third-party applications to provide a unified view of your data.
We follow stringent data validation and cleansing processes to ensure the accuracy and reliability of the visualized data. Additionally, we collaborate closely with your team to verify the data sources and results.
Absolutely! We specialize in creating custom dashboards and reports tailored to your specific requirements, providing insightful and actionable data presentations.
You can request a data visualization project by contacting our sales team through our website, email, or by calling our office. We will discuss your needs and provide a detailed proposal.
The turnaround time depends on the complexity and scope of the project. Generally, smaller projects can be completed within a few weeks, while larger projects may take several months.
Yes, we offer comprehensive training sessions to help your team understand and make the most of the data visualizations we create. This includes how to interact with dashboards, generate reports, and interpret the visualized data.
The cost of our data visualization services varies based on the complexity and requirements of the project. We offer flexible pricing plans tailored to your specific needs. Contact us for a detailed quote.
CONTACT
Unlock Insights with Powerful Data Visualizations!

Tomasz Banach

